Implement Metric Filter to profile memory usage for AWS Lambda Functions in AWS CloudFormation
Not long ago I came across the problem that I wanted to know in detail how much of the allocated memory my individual lambda functions consumes.
Since memory consumption is not part of the standard Lambda metrics, I had to find an individual solution.
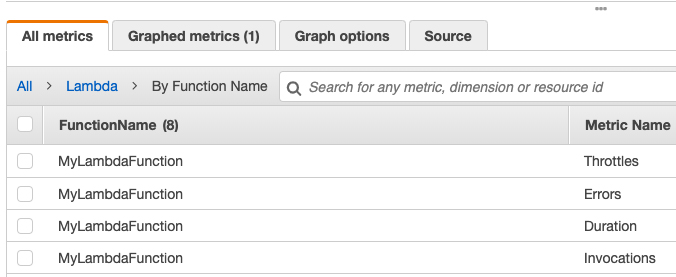
As each lambda execution logs the memory usage I thought about implementing a metric filter extracting this information to create a custom metric in AWS CloudWatch.

A sample metric filter was quickly found on the AWS forums (related thread).
You can test the metric filter by applying it to the log group of a lambda function like I did in the example below:
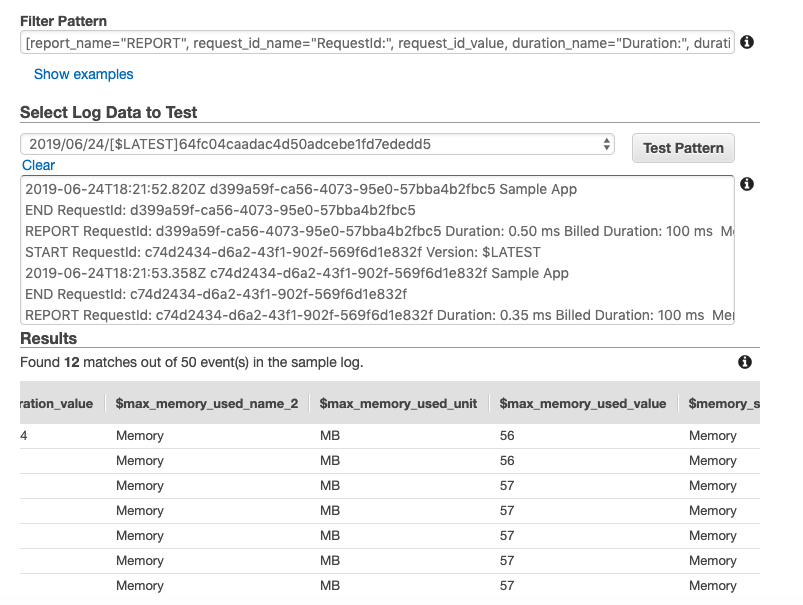
Now since verified the metric filter is actually working I only had to implement it in CloudFormation to be able to evaluate the memory consumption. It is important that a function name is defined so that the log group belonging to the Lambda function can also be created using the CloudFormation template.
You can find the template below:
AWSTemplateFormatVersion : 2010-09-09
Description : Sample App
Resources:

  LambdaExecutionRole:
    Type: AWS::IAM::Role
    Properties:
      AssumeRolePolicyDocument:
        Version: '2012-10-17'
        Statement:
        - Effect: Allow
          Principal:
            Service:
            - lambda.amazonaws.com
          Action:
          - sts:AssumeRole
      Policies:
        -
          PolicyName: allowLambdaLogging
          PolicyDocument:
            Version: "2012-10-17"
            Statement:
              -
                Effect: "Allow"
                Action:
                  - "logs:*"
                Resource: "*"

  MyLambdaFunction:
    Type: AWS::Lambda::Function
    Properties:
      Code:
        ZipFile: >
          exports.handler = (event, context) => {
            console.log("Sample App")
            return Promise.resolve("Done");
          };
      FunctionName: MyLambdaFunction
      Handler: index.handler
      Runtime: nodejs8.10
      Role: !GetAtt LambdaExecutionRole.Arn
      MemorySize: 128
      Timeout: 20

  MyLambdaFunctionLogGroup:
    Type: AWS::Logs::LogGroup
    Properties:
      LogGroupName: !Sub '/aws/lambda/${MyLambdaFunction}'
      RetentionInDays: 7

  MyLambdaFunctionMemoryConsumptionMetricFilter:
    Type: AWS::Logs::MetricFilter
    Properties:
      FilterPattern: '[report_name="REPORT", request_id_name="RequestId:", request_id_value, duration_name="Duration:", duration_value, duration_unit="ms", billed_duration_name_1="Billed", bill_duration_name_2="Duration:", billed_duration_value, billed_duration_unit="ms", memory_size_name_1="Memory", memory_size_name_2="Size:", memory_size_value, memory_size_unit="MB", max_memory_used_name_1="Max", max_memory_used_name_2="Memory", max_memory_used_name_3="Used:", max_memory_used_value, max_memory_used_unit="MB"]'
      LogGroupName: !Ref MyLambdaFunctionLogGroup
      MetricTransformations:
        - MetricValue: "$max_memory_used_value"
          MetricNamespace: !Sub "${AWS::StackName}/MyLambdaFunction"
          MetricName: "Memory"
Quelle: Gist auf GitHub
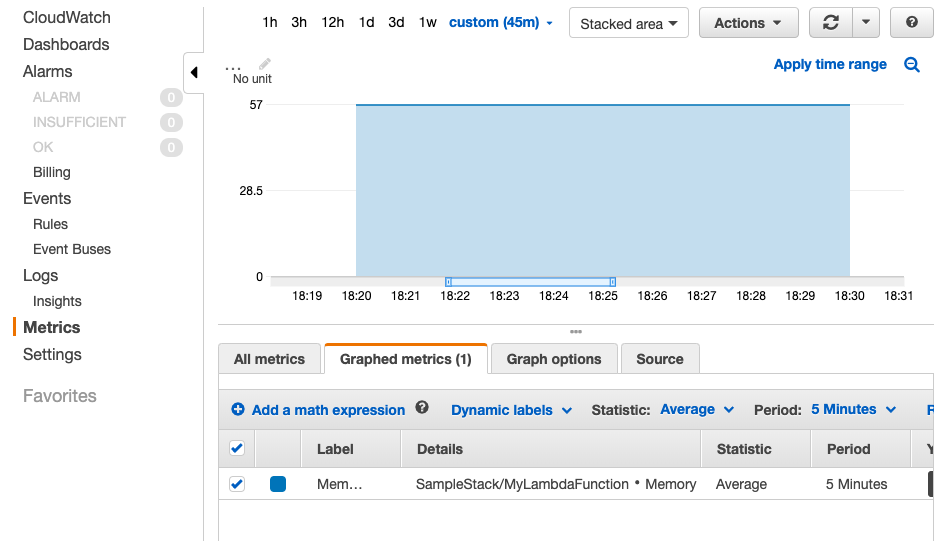
Now you can find the memory consumption metric under StackName > LambdaFunctionName > Memory in AWS CloudWatch: